Samsung’s Memory Revenue Up 471%: Deconstructing the AI Storage Windfall
Samsung’s memory business is benefiting from a powerful combination: rising selling prices, stronger server demand, and a product mix increasingly shaped by AI infrastructure. The result is a revenue and profit expansion that is changing how investors evaluate an industry traditionally associated with steep cycles.
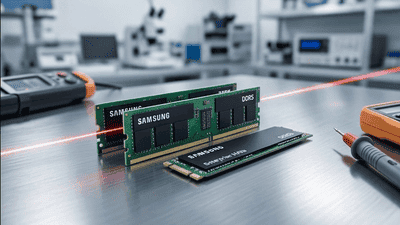
The 471% figure in the title requires caution. It could not be verified as a clearly defined Samsung memory-revenue comparison with an identifiable reporting period and baseline. It should not be confused with consolidated revenue growth, Device Solutions growth, or operating-profit growth. The confirmed second-quarter announcement described record memory revenue and profit, supported by server products and industry-wide price increases.
The more useful story is therefore about decomposition: separating price, shipment volume, product mix, and profitability to understand what the AI-related windfall actually represents—and how much of it might last.
First, Identify Which Business the Headline Describes
Samsung Electronics contains several businesses. Consolidated results include more than semiconductors, while Device Solutions includes memory alongside foundry and system-chip activities.
The Memory Business is a narrower category. A percentage calculated for that business cannot automatically be applied to the entire company or to Device Solutions.
The accounting measure matters as well. Revenue, operating profit, and net income answer different questions. Rapid profit growth can reflect operating leverage even when revenue rises much less dramatically.
For readers, the first requirement is a consistent comparison: the same business, metric, currency, and period. Without those boundaries, a large percentage can communicate excitement while obscuring the actual financial development.
A 471% Increase Would Mean More Than Five Times the Base

Mathematically, a 471% increase means the new figure is 5.71 times the original figure. It does not mean that revenue reaches 4.71 times the previous level.
That arithmetic is straightforward. Establishing the underlying data is the difficult part.
A valid claim would need the current memory-revenue figure, the comparison figure, and an explanation of whether the change is year over year or sequential. Currency translation can introduce another difference.
Until those details are established, the percentage is best treated as an unverified headline rather than a reported operating fact. The broader expansion can still be analyzed through confirmed disclosures and clearly identified expectations.
The Confirmed Second Quarter Shows the Direction
Samsung reported consolidated second-quarter 2026 revenue of ₩171.5 trillion, up 28% sequentially. Device Solutions sales increased 56% quarter over quarter, while the Memory Business recorded new quarterly highs in revenue and operating profit.
The company attributed the memory result to AI-related demand, a focus on server products despite limited capacity, and rising industry prices. It also said server revenue reached a record share of the memory sales mix.
These details support a strong operating story without requiring the unverified 471% comparison.
They also identify the relevant mechanisms. The improvement was not merely more physical memory shipped. Product allocation and pricing were central to the result.
Price Can Transform Revenue Faster Than Output

Memory revenue depends on how much product is sold and the price realized for that product. Changes in mix complicate the relationship because not every bit earns the same value.
A supplier can increase revenue rapidly when prices rise, even if manufacturing output grows more gradually.
That distinction matters during a tight market. It prevents an extraordinary sales increase from being interpreted as an equally extraordinary expansion in physical capacity.
For analysts, prices and shipments need separate assumptions. A model that combines them into one growth rate makes it harder to identify what happens if pricing stabilizes while volume continues increasing.
Product Mix Adds a Third Growth Driver
Samsung’s memory portfolio serves different applications. HBM, server DDR5, mobile memory, NAND components, and finished storage products do not have identical commercial characteristics.
Increasing the share of higher-value products can raise average revenue even when comparable-product pricing changes less dramatically.
The same principle applies to profitability. A richer mix may improve margins, but development, manufacturing, and support requirements also differ.
From an investor’s perspective, the key question is whether the mix shift is durable. Recurring adoption of qualified products provides stronger evidence than a temporary allocation adjustment during a period of scarcity.
HBM Is the Visible Catalyst, Not the Entire Business

High-bandwidth memory supports bandwidth-intensive accelerator workloads. Its stacked structure and integration requirements create a different commercial setting from conventional memory modules.
That makes HBM an important source of AI-related demand. However, assigning all memory growth to HBM would overlook server DRAM, NAND pricing, and enterprise storage.
Samsung’s second-quarter disclosure described expanding HBM4 sales and shipping HBM4E samples to major customers. Samples represent a development milestone; they should not be treated as broad commercial deployment.
For investors, the relevant distinction is between present revenue contribution and future product opportunity. Both matter, but they enter the financial model at different stages.
DDR5 Broadens the Server-Memory Opportunity
AI infrastructure still needs conventional working memory outside the accelerator. Host systems run software, prepare data, and support applications that depend on system DRAM.
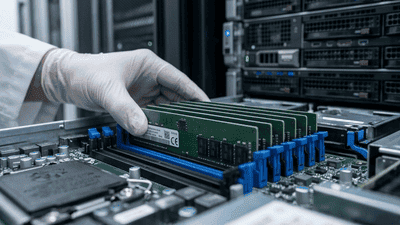
DDR5 therefore provides a separate demand pathway. Its opportunity depends on server shipments, memory content, module configuration, and platform qualification.
A larger accelerator deployment does not create one universal DDR5 requirement. Training, inference, database, and supporting-service architectures can differ.
For Samsung, a greater server-memory mix can support the revenue profile. For analysts, the configuration math is essential: how many memory-bearing systems are deployed, what capacity each uses, and which qualified products satisfy the requirement?
NAND Connects AI with Persistent Data
NAND flash provides nonvolatile storage. It holds information that must remain available after power is removed, unlike ordinary working DRAM.
AI workflows create several persistent-data requirements: datasets, checkpoints, retrieval information, logs, and model artifacts. Those activities do not all demand the same storage characteristics.
Some emphasize capacity; others emphasize throughput, latency consistency, or sustained writes. The finished product needs to match the workload.
This makes the NAND windfall more specific than a broad rise in AI spending. Demand becomes commercially meaningful when customers buy qualified products and deploy them repeatedly.
Enterprise SSDs Are More Than Packaged NAND
An enterprise SSD combines flash with controllers, firmware, interfaces, validation, and support. Its value depends on the complete system.
Customers evaluate endurance, reliability, power behavior, and performance under realistic activity. An alternative with the same advertised capacity is not automatically an equivalent replacement.
That qualification can make supply less immediately interchangeable and support stronger supplier relationships.
However, it does not eliminate bargaining or competition. Customers can validate additional drives, adjust architectures, and improve utilization. The durable opportunity lies in meeting evolving requirements, not assuming that an approved product retains its position indefinitely.
Consumer Demand Can Follow a Different Path
A memory business can benefit from enterprise investment while consumer applications face budget pressure. Higher component prices can make PCs and smartphones more expensive to produce.
Manufacturers can respond by adjusting configurations, using inventories, or moderating procurement. Individual buyers can postpone upgrades.
Those responses create a more flexible demand environment than some enterprise deployments, where storage or memory is necessary to support a valuable service.
For analysts, the difference explains why a strong company result need not imply equal health across every end market. Product mix can become increasingly important to both revenue and margin.
Operating Leverage Magnifies the Profit Effect
Memory manufacturing requires substantial investment in facilities, equipment, process development, and supporting operations. Many costs do not move proportionately with selling prices in the short term.
When realized prices strengthen, a significant portion of additional revenue can reach operating profit, depending on utilization and execution.
The same sensitivity works in reverse. A price decline can weaken earnings even while production remains substantial.
For investors, this is the main reason to distinguish a remarkable quarter from a durable earnings base. Exceptional profitability can demonstrate the business’s potential without establishing that current conditions will persist.
The Third-Quarter Update Is Still Preliminary
Samsung’s October 8 preliminary guidance estimated third-quarter consolidated revenue of ₩195 trillion and operating profit of ₩107.4 trillion. Those represented approximately 127% and 783% year-over-year increases, respectively—not a 471% memory-revenue disclosure.
The distinction is important because preliminary consolidated guidance does not provide a complete segment-level explanation.
Memory was widely expected to account for much of the improvement, but the detailed contribution still required the full results.
As of October 9, the appropriate analysis separates the confirmed second-quarter explanation from the preliminary third-quarter totals. Expectations about product contributions should not be presented as completed disclosures.
Extraordinary Results Can Still Miss Expectations
Financial markets compare performance with what investors anticipated, not only with the previous year.
A company can report record profit while failing to satisfy an even more optimistic consensus. A strong outlook can have the same problem if the valuation already assumes something stronger.
This makes the revenue-growth headline an incomplete investment signal.
For a portfolio manager, the relevant question is whether results change the expected future cash flows relative to the price paid. A good business development and a good stock return are connected, but they are not identical.
Capital Allocation Determines the Next Phase
Strong prices give manufacturers incentives to expand output, improve technology, and increase qualified capacity. Those responses can eventually change the market balance.
New facilities take time to become productive. Technology transitions and yield improvements can affect output on different schedules.
The investment must also earn an acceptable return. Spending aggressively during a strong cycle can become difficult if demand or prices later moderate.
For investors, the windfall matters partly because it creates financial flexibility. The durable benefit depends on how that flexibility is used and whether future capacity remains aligned with customer needs.
Inventory Can Reveal Where Demand Is Running Ahead
Customers sometimes purchase before deployment to secure supply. That can improve supplier shipments while building stock elsewhere in the chain.
Later, those customers can consume buffers and reduce orders without a corresponding collapse in activity.
A useful assessment therefore follows producer inventories, customer procurement, and actual deployment where information is available.
For Samsung’s memory story, the strongest evidence would show that higher shipments and prices are supported by continuing consumption. A procurement surge alone can be less durable than the revenue headline suggests.
What to Monitor Beyond the Headline
A disciplined dashboard separates the business drivers and reporting categories.
- Identify memory revenue separately from consolidated and Device Solutions figures.
- Distinguish reported results from preliminary guidance and forecasts.
- Track selling prices, shipments, and product mix independently.
- Follow HBM deployment separately from next-generation samples.
- Assess DDR5 configurations and enterprise SSD adoption.
- Compare profit with cash generation and necessary investment.
These measures turn an eye-catching percentage into a testable operating thesis.
Three Ways the Windfall Could Evolve
A sustained-tightness scenario combines resilient server demand, gradual supply additions, and favorable product mix. Revenue and profitability remain supported.
A volume-led scenario involves continued deployment while price increases moderate. Sales can grow, but the profit response may become less dramatic.
A rebalancing scenario emerges if output expands faster, customer purchasing slows, or inventories accumulate. Current earnings then create a demanding comparison base.
These are analytical frameworks, not forecasts with assigned probabilities. Their purpose is to clarify what evidence would strengthen or weaken the durability argument.
The Windfall Is Real; the Attribution Needs Discipline
Samsung’s confirmed memory disclosures describe a powerful expansion supported by server products, AI-related demand, and rising prices. The requested 471% revenue figure remains unverified without a defined period and comparison basis.
DDR5, NAND, and enterprise SSDs each contribute through different functions and commercial conditions. HBM is important, but it is not the complete explanation.
The lasting question is whether favorable pricing becomes sustained customer value and cash generation. Deconstructing the windfall makes that question easier to answer—and prevents a dramatic headline from replacing the analysis.